Creating a custom grid
Emiproc provides many useful tools to work with gridded data. The only thing you need is to tell emiproc how your grid is defined. For this purpose emiproc implements an abstract class Grid.
This tutorial aims to show how to create a custom grid for your own needs.
Understanding geopandas and shapely
Geopandas will help us generate the geometry of the grid.
The principle is that each grid cell is a polygon.
Polygons are simply a list of 2d point coordinates that are connected by lines. So only by defining the points of the polygon, we can create a grid cell.
In geopandas you can create Series of polygons.
[6]:
import geopandas as gpd
import shapely


polygon = shapely.geometry.Polygon([(0, 0), (1, 0), (1.5, 0.5), (1, 1), (0, 1)])
polygon2 = shapely.geometry.Polygon([(1.5, 0.5), (1.5, 1.5), (0.5, 1.5)])

goeserie = gpd.GeoSeries([polygon, polygon2])
goeserie.explore()
[6]:
Georeferencing the grid
The grid can be georeferenced by defining the coordinate reference system (CRS) of the grid. Most of the time we use the World Geodetic System 1984 (WGS84). https://en.wikipedia.org/wiki/World_Geodetic_System_1984
Thanks to geopandas, we can easily define the CRS of the grid.
[75]:
goeserie = gpd.GeoSeries([polygon, polygon2], crs="WGS84")
goeserie.explore()
[75]:
Getting the bounds of the grid
Usually grids are defined in the input files of the model or inventory. This is your job to get the data and to read it.
In many cases the inventories and models are defined on regular lat/lon grids. However, in some cases, we can face more exotic kinds of grids.
In this example we will create a small regular grid.
[69]:
import numpy as np

right_x = np.arange(1.0, 4.0)
left_x = right_x - 1.0
bottom_y = np.arange(1.0, 5.0)
top_y = bottom_y + 1.0


left_bot_x, left_bot_y = np.meshgrid(left_x, bottom_y)
right_top_x, right_top_y = np.meshgrid(right_x, top_y)
left_top_x, left_top_y = np.meshgrid(left_x, top_y)
right_bot_x, right_bot_y = np.meshgrid(right_x, bottom_y)
Now that we have the coordinates we can create the grid.
In general we don’t want to create each polygon one by one for performance reasons. We can use some functions to create them all at once.
[79]:
from shapely.creation import polygons

geometries = np.asarray(
    [
        np.stack(
            (
                left_bot_x.ravel(),
                right_bot_x.ravel(),
                right_top_x.ravel(),
                left_top_x.ravel(),
            )
        ),
        np.stack(
            (
                left_bot_y.ravel(),
                right_bot_y.ravel(),
                right_top_y.ravel(),
                left_top_y.ravel(),
            )
        ),
    ]
)
# Here when creatin the polygons, we need to transpose the geometries to have
# the shape = (polygons, points, coordinates)
geoserie = gpd.GeoSeries(polygons(geometries.T))
geoserie
[79]:
0     POLYGON ((0.00000 1.00000, 1.00000 1.00000, 1....
1     POLYGON ((1.00000 1.00000, 2.00000 1.00000, 2....
2     POLYGON ((2.00000 1.00000, 3.00000 1.00000, 3....
3     POLYGON ((0.00000 2.00000, 1.00000 2.00000, 1....
4     POLYGON ((1.00000 2.00000, 2.00000 2.00000, 2....
5     POLYGON ((2.00000 2.00000, 3.00000 2.00000, 3....
6     POLYGON ((0.00000 3.00000, 1.00000 3.00000, 1....
7     POLYGON ((1.00000 3.00000, 2.00000 3.00000, 2....
8     POLYGON ((2.00000 3.00000, 3.00000 3.00000, 3....
9     POLYGON ((0.00000 4.00000, 1.00000 4.00000, 1....
10    POLYGON ((1.00000 4.00000, 2.00000 4.00000, 2....
11    POLYGON ((2.00000 4.00000, 3.00000 4.00000, 3....
dtype: geometry
Creating the grid object
emiproc provides the Grid class to create a grid object.
If you create the geoseries of polygons, you can use the class :py:class:emiproc.grids.GeoPandasGrid to create the grid object.
What is usually recommended if you need the data from a file is to create sub class from the :py:class:emiproc.grids.Grid class and to implement reading the file and generating the grid in the __init__ method.
[76]:
from emiproc.grids import GeoPandasGrid


class MyModelGrid(GeoPandasGrid):
    """Mymodel grid.

    A grid for my model.

    Put any documentation here.
    """

    def __init__(self, grid_file_path):

        # Read the grid file
        ...

        # Extract the coordinates

        coordinates_arrays = ...

        # Create the polygons

        geometries = ...
        geoserie = gpd.GeoSeries(polygons(geometries), crs="your_crs")

        # (optional) Get the shape of the grid
        # You can use this if you have a grid given in 2d coordinates
        nx, ny = ...

        # Pass the geoserie to the parent class
        super().__init__(geoserie, name="MyModelGrid", shape=(nx, ny))
Our example
Let’s see how this works in our example.
[78]:
class ExampleGrid(GeoPandasGrid):
    def __init__(self):
        right_x = np.arange(1.0, 4.0)
        left_x = right_x - 1.0
        bottom_y = np.arange(5.0, 10.0)
        top_y = bottom_y + 1.0

        left_bot_x, left_bot_y = np.meshgrid(left_x, bottom_y)
        right_top_x, right_top_y = np.meshgrid(right_x, top_y)
        left_top_x, left_top_y = np.meshgrid(left_x, top_y)
        right_bot_x, right_bot_y = np.meshgrid(right_x, bottom_y)

        geometries = np.asarray(
            [
                np.stack(
                    (
                        left_bot_x.ravel(),
                        right_bot_x.ravel(),
                        right_top_x.ravel(),
                        left_top_x.ravel(),
                    )
                ),
                np.stack(
                    (
                        left_bot_y.ravel(),
                        right_bot_y.ravel(),
                        right_top_y.ravel(),
                        left_top_y.ravel(),
                    )
                ),
            ]
        )
        geoserie = gpd.GeoSeries(polygons(geometries.T), crs="WGS84")

        super().__init__(geoserie, name="ExampleGrid", shape=(3, 4))


# Finally we can create an instance of the grid
grid = ExampleGrid()
grid.gdf.explore()
[78]:
Checking your grid
As you have already seen above you can check your grid by plotting it with the explore function.
However sometimes the grid is large and this function will be buggy.
So we recommend selecting only a few cells to plot.
# Select the first 100 cells
grid.gdf.iloc[:100].explore()
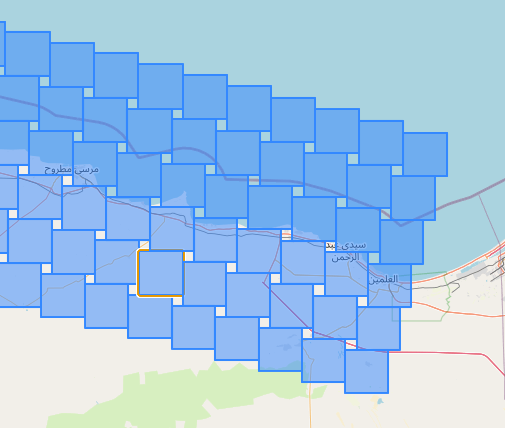
Sometimes you will see your implementation is wrong like in this example: